Ziya Teknik: product-level Meta Ads and local visibility
1,158 customer conversations from ads at TRY 10.47 each. Google Business Profile interactions above the previous year for five months running.
- Role
- The whole digital side — tracking setup, ads, local SEO and content
- Period
- Dec 2025 – present
- Platforms
- Meta Ads, Google Business Profile, Search Console, GA4
- Budget
- TRY 12,129.41 (Jul 12 – Sep 12, 2026)
- 1,158 Customer conversations started
- TRY 10.47 Cost per conversation
- 963 Google Business Profile interactions (5 months)
- 0 , now 170 Followers
Context
Ziya Teknik is a lithium battery service in Akdeniz, Mersin, running since 2020. It rebuilds batteries for kids’ ride-on cars, cordless drills, e-bikes, scooters, robot vacuums and hoverboards, and also builds custom battery packs for specific projects. Cell replacement, BMS fitting and spot welding are done in the workshop, with a six-month warranty on labor. More than 1,500 batteries have been built so far, and the business has a 4.8 rating from 58 reviews on Google Maps.
On the digital side, what shapes the work is this range of devices. The robot vacuum owner whose battery has died and the tradesman whose cordless drill won’t run are looking for the same workshop, but they don’t search for the same words; a single “battery repair” message doesn’t catch both. That’s why I split the ad sets and the content by device.
Problem
The business has been running since 2020 and has won its customers largely through word of mouth. That is a real channel — happy customers come back and tell people they know — but at some point it hits its own limit. New customers only come from as far as an old customer’s circle reaches.
A battery failure, though, is an urgent need that starts with a search. Someone typing “can a robot vacuum battery be replaced” or “cordless drill battery rebuild” has no workshop in mind; they pick up their phone and look. If you don’t show up at that moment, the job goes elsewhere — and word of mouth never reaches that person at all.
Being visible online does two jobs here at once: it reaches people who have never heard of the brand, and it turns that straight into revenue — because someone who arrives by searching already has the need and is ready to buy.
What I did
The work moved in three stages: I started in April 2026, widened the scope on June 1, and switched on the ad budget in July. That order helps when reading the numbers below — it separates which increase came from what.
1. Google Business Profile
For a local business, this is the channel that turns into work most often: the searcher taps to call, gets directions or clicks through to the site. After I overhauled the profile, interactions stayed above the same month of the previous year for five months in a row.
I worked on two things.
Profile content. I rewrote the description and the services section. Seven service lines (kids’ ride-on cars, cordless drills, e-bikes, scooters, robot vacuums, hoverboards, custom battery builds) are now defined separately on the profile — the profile-side answer to the “not everyone searches the same words” problem from the context above.
Social media. I increased content output, but the real point was the look, not the volume. Content in this sector is usually quickly shot repair videos that all look alike; I tried to build a visual language that steps outside that — designed with care and able to hold the viewer’s attention.
That was a deliberate choice: if you lose a keyword you can win it back other ways, but becoming “the place that takes its work seriously” in people’s minds is earned more slowly. So whenever I had to choose between a short-term search gain and brand awareness, I put awareness first.
Every post follows the same structure: one device, compatible brands, the warranty period and a single call to action. Instead of a scattered “we fix everything” message, each post answers one search. There’s an example in the screenshots below.
The call to action being “send a message” isn’t a coincidence. I set up the ad campaigns with a messaging objective too, so organic posts and ads both lead people to the same place. I didn’t want to split traffic by saying “call us” in one place and “visit the site” in another — for a small business, going deep on one channel works better than half-opening three.
| Month | Interactions | vs. previous year |
|---|---|---|
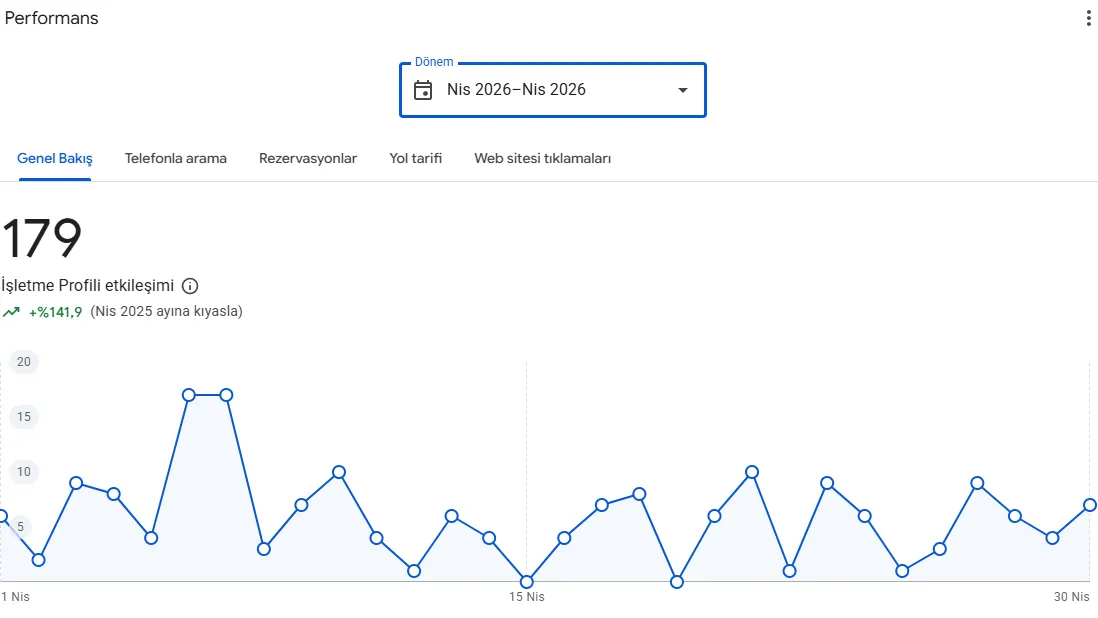
| April 2026 | 179 | +141.9% |
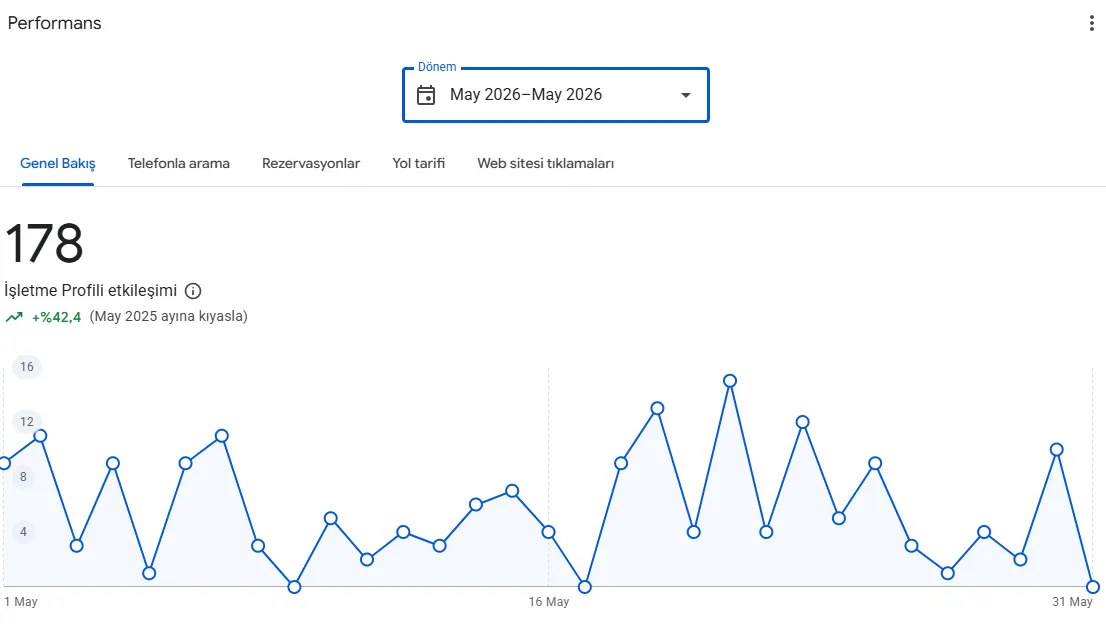
| May 2026 | 178 | +42.4% |
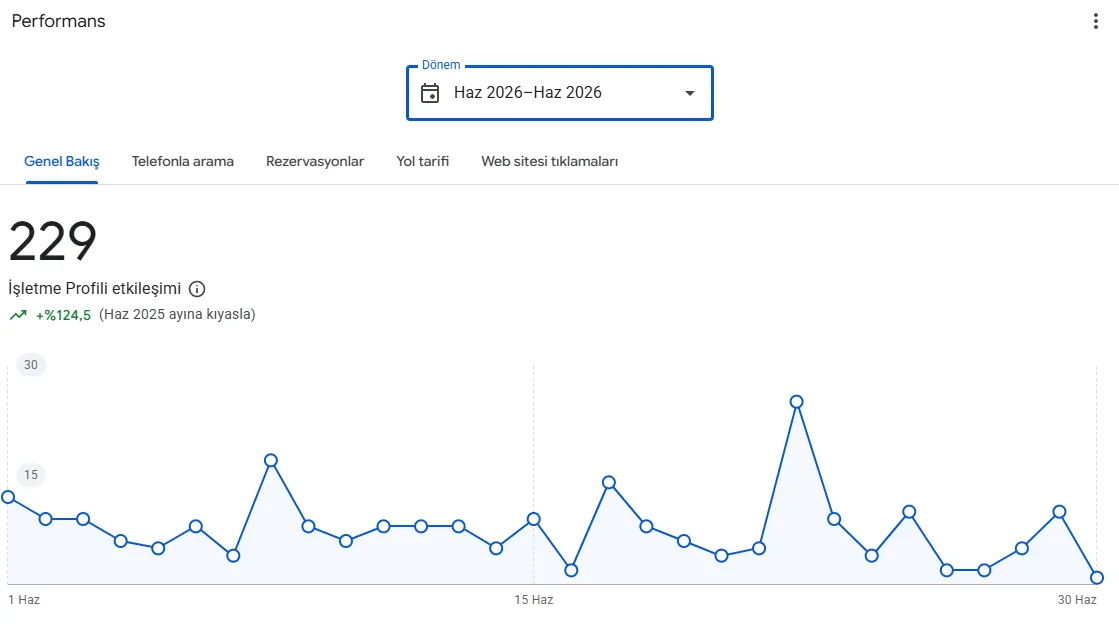
| June 2026 | 229 | +124.5% |
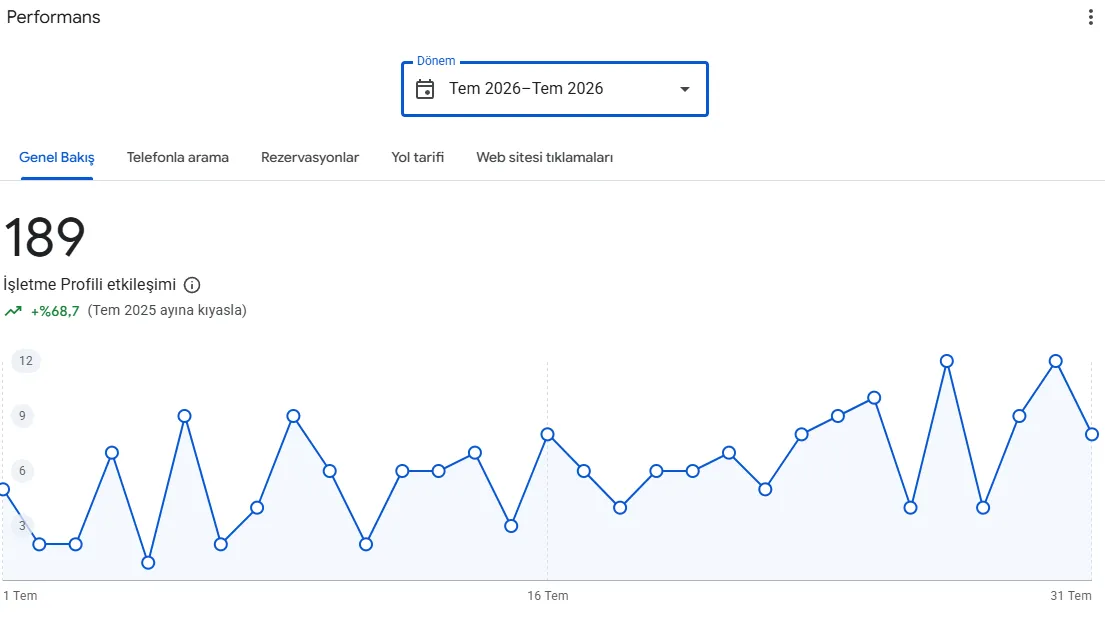
| July 2026 | 189 | +68.7% |
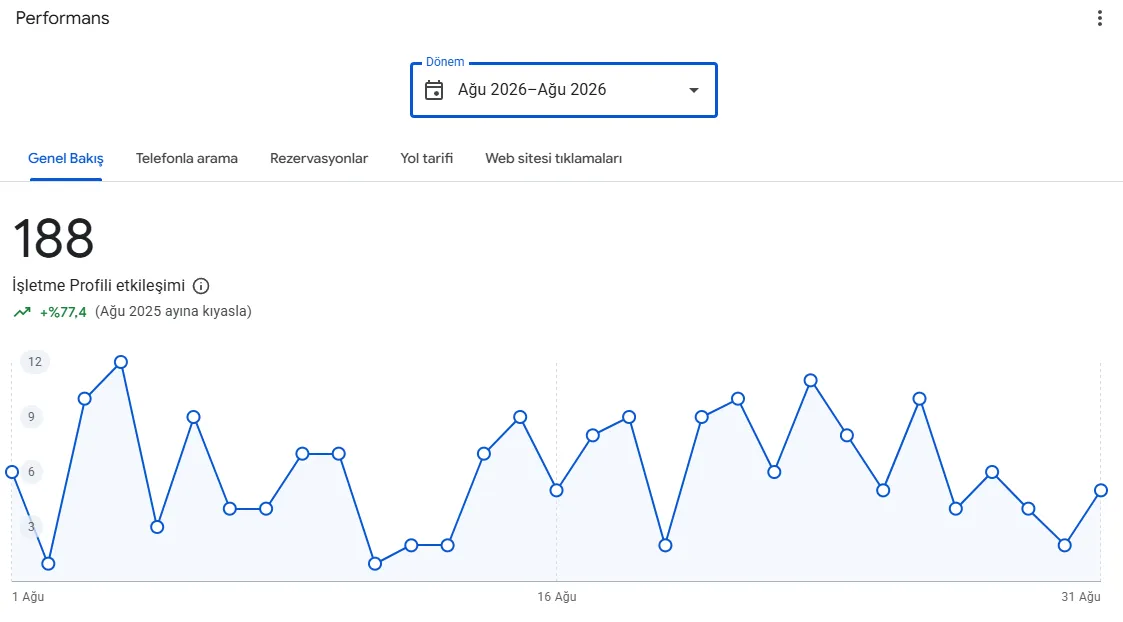
| August 2026 | 188 | +77.4% |
The five months add up to 963 interactions.
The dates matter here. The work started in April, the scope widened on June 1, and the ad budget only went live in July. So the entire rise from April to June came without ads: it was the result of the profile work and local search. June (229, +124.5%) is both the highest of the five months and the first full month after the scope widened.
July (189) and August (188) came in below June. That happens every year: in summer, people spend their time and money on holidays and put repairs off until autumn. We expected the dip.
The key point is this: because each month is compared with the same month the year before, seasonality is on both sides. So even in the two slowest months of the season, the numbers stayed 68% and 77% above the same months last year. The dip comes from the calendar, not from the work.
2. Meta Ads — product-level ad sets
Instead of one generic ad, I split the campaign by product/service: vacuum, e-bike, hoverboard, kids’ ride-on car, drill, scooter, robot vacuum. That way I can see separately which product draws interest and which one comes in expensive.
I split the sets along the service lines the workshop actually offers. But the main reason wasn’t easier reporting: the people searching for these devices are different from each other. A homeowner whose robot vacuum battery has died and a tradesman whose cordless drill won’t run don’t react the same way to the same image or the same sentence. Rather than speak to both with one creative, each set carried its own.
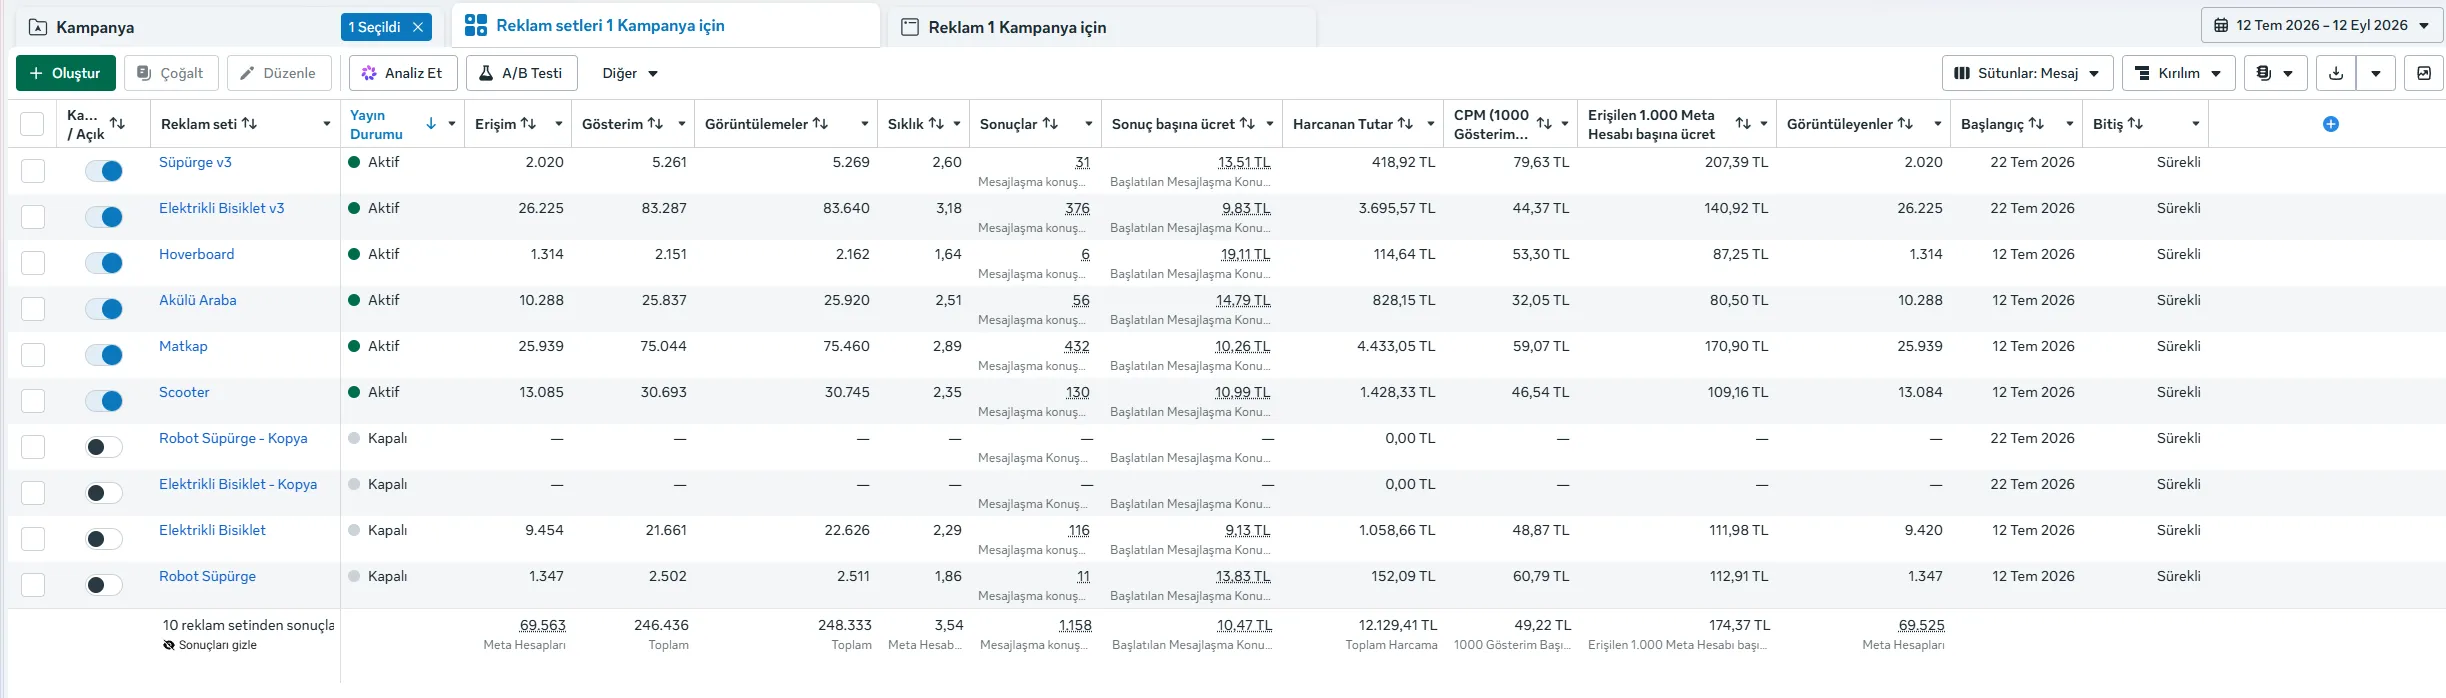
Results (Jul 12 – Sep 12, 2026):
| Ad set | Conversations | Per conversation | Frequency | Spend | Status |
|---|---|---|---|---|---|
| Drill | 432 | TRY 10.26 | 2.89 | TRY 4,433.05 | Active |
| E-bike v3 | 376 | TRY 9.83 | 3.18 | TRY 3,695.57 | Active |
| Scooter | 130 | TRY 10.99 | 2.35 | TRY 1,428.33 | Active |
| E-bike | 116 | TRY 9.13 | 2.29 | TRY 1,058.66 | Off |
| Kids’ ride-on car | 56 | TRY 14.79 | 2.51 | TRY 828.15 | Active |
| Vacuum v3 | 31 | TRY 13.51 | 2.60 | TRY 418.92 | Active |
| Robot vacuum | 11 | TRY 13.83 | 1.86 | TRY 152.09 | Off |
| Hoverboard | 6 | TRY 19.11 | 1.64 | TRY 114.64 | Active |
Each month’s Ads Manager screenshot is on the ad panels page.
Most of the budget went to the two sets that brought in the most conversations: drill and e-bike v3 together took more than two thirds of total spend.
Switching sets off wasn’t about cost. The E-bike set was turned off when its v3 version went live — we moved to a refreshed creative for the same product; at TRY 9.13 per conversation it was already the cheapest of all the sets.
The two most expensive sets per conversation — Hoverboard (TRY 19.11) and Kids’ ride-on car (TRY 14.79) — were deliberately left on. The workshop services those devices too; if they never appear in ads, we lose that demand entirely. I accept the cost gap to keep the range of services visible, because it’s an affordable gap: together the two take less than eight percent of total spend, and Hoverboard alone is TRY 114.64.
This isn’t unlimited tolerance. If the cost rises past the point where it can be ignored, those sets get switched off too; I’m keeping an eye on it.
I do that through a report that lands in Telegram every morning: each set is compared with its own previous days, and any set going wrong is flagged on the first line. I’ve described how it works on a separate page.
3. Creative iteration
The v3 markers on the ad sets come from version tracking — I rebuilt the
creative for the same product more than once.
Moving from E-bike to v3, I changed who saw the ad more than the creative itself. Two changes:
Target area. I rebuilt the geographic targeting.
Excluding frequent viewers. I removed people who had started seeing the ad often from the audience and went after completely new people. An ad shown to the same person over and over stops bringing new conversations at some point and just spends budget. The frequency column in the table shows this: how many times on average one person saw the ad. Across the campaign, that number was climbing as high as 3.54.
Once frequency passes 3, I start stepping in. But I don’t decide on that number alone: if results are still coming, I leave the set alone. E-bike v3 in the table is an example — its frequency of 3.18 is above the threshold, but at TRY 9.83 per conversation it’s one of the cheapest sets. So it stayed on. For me, frequency is a warning, not a decision.
4. Follower growth
Followers went from 0 to 170. The growth started in June, when I expanded content output, and sped up in July once the ads went live.
I had set up the ads with a messaging objective, so gaining followers wasn’t their direct aim — but as the posts reached more people, follows came along behind. The two fed each other: without content, the interest the ads brought would have had nothing to hold on to; without ads, the content wouldn’t have reached this many people.
Result
Ads. Over the two-month period, a TRY 12,129.41 budget started 1,158 customer conversations — TRY 10.47 per conversation. The ads reached 69,563 people and earned 246,436 impressions.
Organic. Google Business Profile interactions reached 963 in total between April and August 2026; all five months stayed above the same month of the previous year. The biggest gains came in April (+141.9%) and June (+124.5%) — one the first month of the work, the other the first full month after the scope widened; both before the ad budget was switched on.
Screenshots of the work
The numbers are left exactly as they appear in the dashboards.

If you have a question about this project, drop me a line.